Tuesday, October 6, 2009

Story of the Day...Gold Makes New Highs...or not?

Having accumulated positions in GLD, GDX, and SLV for the past few months, I'm pleased that gold broke out today to all time highs relative to the dollar.


The question on many people's minds now is, "What next"? My view is that there are enough skeptics of gold to keep it rising for some time to come. As I stated in Sunday's post, Trading Ideas For the Week http://wallstreetwatchdawg.blogspot.com/2009/10/trading-ideas-for-week.html, I believe that gold is in a secular bull market dating back to 2001, and that secular bulls end in one way, and one way only: With the public becoming irrationally exuberant about the possibilities of wealth generation through the asset in question. In other words, the common thought at the end of this gold bull will be that gold will never go down again. "This time is different" will be the theme of the day. Cab drivers will be buying and selling gold, as will soccer moms, school teachers, grocery clerks, doctors and lawyers. Unfortunately for them, it never is different, and the public's mass immigration into gold, and the popular delusions that accompany it, will be the sign that it is time to look for an exit. Until then I will grab the bull by the horns and ride, adding to positions on swing reverals upwards as gold bounces out of it's cyclical bottoms.

I added to positions today as Gold not only broke through long term resistance, but is also just one week removed from a weekly cycle low. Note that gold has had a consistent rhythm in its weekly cycle of appx 21 to 26 weeks between lows. Thus, I see plenty of support for a sustained move higher. My target for this leg of the advance, between now and next spring, is approximately 1340.

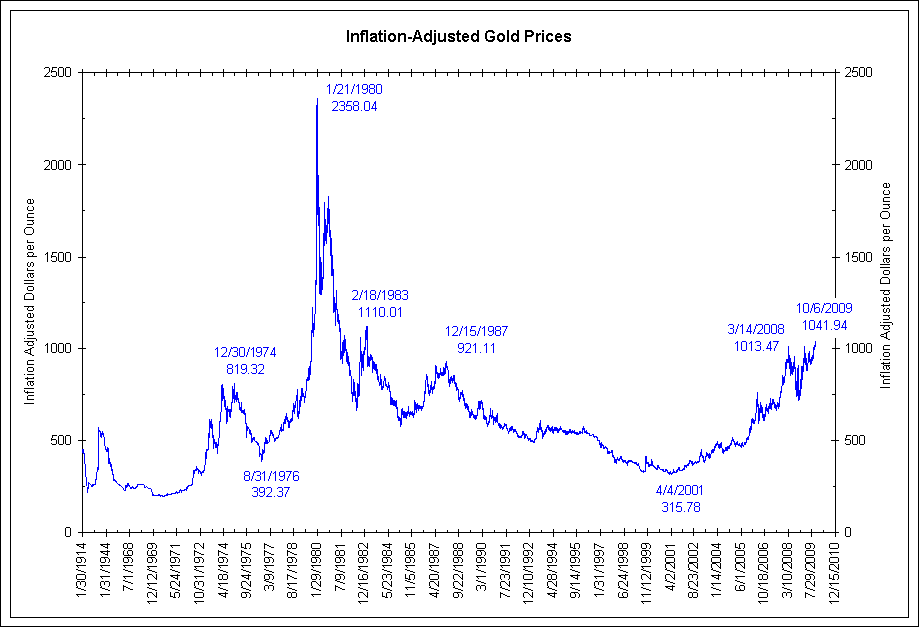
Here's the real chart of gold's current value in inflation adjusted terms.

http://www.ritholtz.com/blog/wp-content/uploads/2009/10/gold-REAL-dollars.gif

Looks bullish to me.

Fubsy

Treasury Department Endorses Lying to the Public

This was found at Zero Hedge from Daniel Hoffmann of Wall Street Cheat Sheet. A good read chronicling yet another example of how the US Government rationalizes half truths, manipulation, and out and out lying. It's funny. when I talk about this with friends I often get a response in the neighborhood of, "That's just the way our government works", or "the people don't want the truth". To which I say, I'm a person and I want the truth. Is it a culturally accepted fact of life that our government is feeding us lies, so they can run their agendas without interference from the public? Pardon my French, but FUCK THAT!! Here's the link.

http://www.zerohedge.com/article/guest-post-treasury-department-endorses-lying-public

Sunday, October 4, 2009

Trading Ideas for the Week

Here are a few compelling charts.

This chart of investment grade bonds suggests a recent change in the supply/demand balance for corporate paper. The steady rise of LQD over the past six months reflected an increasing risk appetite by bond investors. There were virtually no meaningful ticks to the downside over this period. The last two days have seen accelerated selling with increased volume suggesting that large positions are being liquidated, and perhaps the appetite for risk is in the process of decreasing.

Although this may lead to a change in the intermediate, or even long-term trend, I am especially risk averse trying to time shifts in market direction, as it often takes many attempts before a true top (or bottom) materializes. So, I will risk less than 1/4% of my portfolio with this position.

I will short LQD on it's next rally with a swing day reversal with a stop 1% above the high of the move. The number of shares will be determined by the distance between the entry price and the stop price.
Maximum risk: 170.00.

I will add to the position with a series of lower highs and lower lows.

As is stated in the chart, the Russell 2000 has gained appx 85% since the March bottom. My guess is the easy money has been made on the long side. The risk is shifting to the bulls. Anyone holding a position from a transaction occurring between Jan 06 and October 08 represents an eager seller, creating resistance at current levels. I'm not taking a position until one of two things happen: 1) The market fins a bottom, reverses upward, makes a lower high and turns back down breaking through the recent low, which would create a low risk entry, or 2) it rises toward the 62.00 level at which point I will short with any swing day reversal (a close below the low price of day the that the market makes its high for this move) with a stop 1% above the high price of the move.

The utilities have been rebuffed at the 30.00 level repeatedly. This implies a pool of sellers at this level. I'm initiating a small short position (100 shares) with a stop at 30.10.
Maximum risk: 160.00
Again, when I play a trend reversal I always start small as the area of least resistance is in the direction of the current trend. On the other hand, if the trend reverses, the greatest gains occur from being in the move from the beginning. My belief is that a lot of risk has been taken out of the short trade from the move made since March. So, I'm using tactics to get into short postions, and will continue to do this with tight stops until the market turns. I also believe that when the trend shifts downward there will be opportunities to add to the positions while decreasing risk.

There is one asset class that remains in a secular bull market: Gold. Looking at the chart dating back to 2001 it is obvious that the primary trend for gold is up. Gold has been consolidating between 660 and 1000 over the past 18 months. It has traded above the 850 range for most of this consolidation period, which suggests continued buying interest, and not a reversal in it's trend.
850 was the high in 1980. Interestingly, many people believe that gold is expensive given that it's trading near its all time high around 1000 bucks. I disagree. When adjusted for inflation, the high in 1980 would have been closer to 2350. Keep in mind that in 1980 the average new car sold for appx 6000. We are currently at less than half that valuation. I think gold has a long way to go. I have been accumulating small poositions between 850 and 950. I'm also accumulating Silver (SLV) and Gold Miners (GDX).
If I'm correct, and gold is in a secular bull market, I only need to ask myself one question:
How do secular bull markets end? Looking at any previous secular bull dating to the beginning of markets: real estate, tech stocks, industrials, railroads, tulips etc...one will notice that the bull ends when the general public believes that this time is different, and the asset in question will never go down. So, I will be a buyer of precious metals and miners until the time comes that I over hear grocery clerks, cab drivers, and moms at the park talking about buying or better yet, beginning their new venture as gold dealers. My guess is that the weighting of gold in the average portfolio at that time will exceed 25% and many people will have portfolios made up exclusively of gold. That's when I will watch for signs of the uptrend breaking.
Fubsy

Saturday, October 3, 2009

Weekly Links

Tyler Durden, The Fed Rightfully Believes that Protecting Goldman is “In the Interest of the US Economy and the US Public”, Zero Hedge
http://www.zerohedge.com/article/fed-rightfully-believes-protecting-goldman-interest-us-economy-and-interest-public
A caustic and brilliant comparison of the extraordinary promise of open/transparent government by Barack Obama, and Fed chief Ben Bernanke’s appeal of Bloomberg’s lawsuit directed at the Fed’s lack of disclosure related to the spending of taxpayer monies. Awesome!!

Mac Slaveo, Crash/Collapse Dead Ahead. SHTF.com
http://www.shtfplan.com/marc-faber/caution-crashcollapse-dead-ahead-say-faber-rogers-dent-and-celente_10022009
Chronicles commentary by Marc Faber, Jim Rodgers, Gerald Celente and Harry Dent on the coming collapse of stock prices.

Karl Deninger: Is It Time to Recognize Reality? The Market Ticker
http://market-ticker.org/archives/1473-Is-It-Time-To-Recognize-Reality.html
Commentary on a variety of current economic issues/beliefs. Worth a read

John Browne, A Somber G20, 321Gold
http://www.321gold.com/editorials/browne/browne100109.html
John Browne offers his perspective on the G20 summit based on direct observations. He is the senior market strategist for Euro Pacific Capitol, Peter Shiff’s money management firm. Is he biased? Of course. We all are. An interesting perspective, nonetheless.

Eric Sprott, David Franklin: Safe Haven no More, Sprott Asset Management
http://www.sprott.com/Docs/MarketsataGlance/09_09_MAAG.pdf
An article addressing US Debt and dollar devaluation.

Dylan Ratigan: Why Would We Let Them Rig the Game. Huffington Post
http://www.huffingtonpost.com/dylan-ratigan/why-would-we-let-them-rig_b_302480.html
Dylan’s view on the healthcare system and reform.

Friday, October 2, 2009

Unemployment Numbers: Worse than expected...Better than Reality?

Whenever government data comes out, there are numerous research institutions that pull the numbers apart and present data that is significantly different than the government reported, but the numbers suggested by the following three articles are so far askew from the government reported numbers, I can only scratch my head and wonder, what is real? I will do more investigation and share my findings over the next couple weeks.

From Jim Quinn at The Burning Platform: The Plan is Unraveling-Unemplyment Figures are a Fraud.
http://theburningplatform.com/groups/quinns-daily-dose-of-reality/discussions/the-plan-is-unraveling-unemployment-figures-are-a-fraud

From Mish Shedlock at Global Economic Trend Analysis: Huge Downward Jobs Revisions Coming.
http://globaleconomicanalysis.blogspot.com/2009/10/huge-downward-jobs-revisions-coming.html

From Barry Ritholtz at The Big picture: The More You Dig Into the Numbers, the Worse They Get.
http://www.ritholtz.com/blog/2009/10/the-more-you-dig-into-the-numbers-the-worse-they-get/

Thursday, October 1, 2009

Punk BBQ

From 1982. My brother, cousin and a couple friends rocking out in multi-media way ahead of their time. Good times...Love it!!


Housing...Fair Value??

The following chart is one of the most compelling reflections of the credit bubble that I have seen. It was published by Robert Shiller, and shows the average home price adjusted for inflation from 1890 to the present. The chart shows that that although housing values have decreased by some 30% since 2006 they remain above the highest relative value of any period prior to 2002.

With all the emphasis that the government and federal reserve are putting into stabilizing home values, including purchasing 1.2 trillion dollars worth of risky mortgage backed securities (bundles of debt backed by mortgages as collateral), providing an $8,000 refund upon the purchase of a home, offering loan modifications to underwater home owners, providing FHA loans with 3% down, and remarkably, often for principal greater than the assessed value of the home being purchased, I have the following questions:

Is the housing market ready to be stabilized?

Wouldn't it make the most sense for the market to return to historic valuations?

What would a swing to historic valuation look like following the most massive bubble in housing, and arguably, credit over the past 110 years?

Doesn't it seem feasible that housing prices would not only return to mean valuations, but possibly even mirror the spike up with an exaggerated devaluation of home values as excess credit is purged from the system?

If home values do come back to Earth, what will all the incentives aimed at decreasing inventories, boosting consumer sentiment, and jump starting the credit markets really promote? To my thinking, just the opposite. People getting into these new mortgages may again find themselves under water. If they do, this will likely lead to another round of loan defaults, foreclosures, and the tightening of consumer and lender purse strings. Not to mention that in this scenario the stimulative efforts of our government pertaining to the housing sector will add to the weight of already unprecedented US debt relative to economic production.

A grim scenario, but based on the chart, and our as of yet unpurged credit markets, one with reasonable potential.

Fubsy